FX and Stop Loss
04 Nov 2014To install Systematic Investor Toolbox (SIT) please visit About page.
Tad Slaff at InovanceTech published We’re going to explore the backtesting capabilities of R post that I like. Below I will explore it a bit more.
Load Historical Prices. Let’s start with USD/CAD 4 hour bar pricesdropbox.
	#*****************************************************************
	# Load historical data
	#******************************************************************
	library(SIT)
	load.packages('quantmod')

	data <- new.env()
	data$USDCAD = read.xts('data/USDCAD.csv', format='%m/%d/%y %H:%M', index.class = c("POSIXlt", "POSIXt"))
		#plota(data$USDCAD, type='l')
	bt.prep(data, align='remove.na')

if (FALSE) {
	tickers = spl('USDCAD')
	data <- new.env()
	getSymbols.fxhistoricaldata(tickers, 'hour', data,
		download=F, name.has.type = FALSE)
	bt.prep(data, align='remove.na', dates='1990::')
}
Create Strategies
	#*****************************************************************
	# Code Strategies
	#******************************************************************
	prices = data$prices


	models = list()

	dates = '2001::'
	#*****************************************************************
	# Code Strategies: Buy and Hold
	#******************************************************************
	data$weight[] = NA
	  	data$weight[] = 1
	models$Buy.Hold = bt.run.share(data, dates=dates, silent=T, clean.signal=T)

	#*****************************************************************
	# Code Strategies: Long
	#******************************************************************
	#Calculate the indicators we need for our strategy
	CCI20 = CCI(prices,20)
	RSI3 = RSI(prices,3)
	DEMA10 = DEMA(prices,n = 10, v = 1, wilder = FALSE)
	DEMA10c = prices - DEMA10
		DEMA10c = DEMA10c/.0001

	buy.signal = ifelse(RSI3 < 30 & CCI20 > -290 & CCI20 < -100 & DEMA10c > -40 & DEMA10c < -20,1,NA)

	#Set our long entry conditions found by our algorithms and optimized by us in the last post
	data$weight[] = NA
	  	data$weight[] = buy.signal
	models$Long = bt.run.share(data, dates=dates, trade.summary = TRUE, silent=T, clean.signal=T)

	#*****************************************************************
	# Code Strategies: Short
	#******************************************************************

	sell.signal<-ifelse(DEMA10c > 10 & DEMA10c < 40 & CCI20 > 185 & CCI20 < 325 & RSI3 > 50, -1 ,NA)

	data$weight[] = NA
	  	data$weight[] = sell.signal
	models$Short = bt.run.share(data, dates=dates, trade.summary = TRUE, silent=T, clean.signal=T)

long.short.strategy<-iif(RSI3 < 30 & CCI20 > -290 & CCI20 < -100 & DEMA10c > -40 & DEMA10c < -20,1,iif(DEMA10c > 10 & DEMA10c < 40 & CCI20 > 185 & CCI20 < 325 & RSI3 > 50, -1 ,NA))

	data$weight[] = NA
	  	data$weight[] = long.short.strategy
	models$Long.Short = bt.run.share(data, dates=dates, trade.summary = TRUE, silent=T, clean.signal=T)


	#*****************************************************************
	# Create Reprot
	#******************************************************************
	#Isolate the dates from our validation set (The data not used to train the model or create the rules, our out-of-sample test)
	dates = '2014-02-26::2014-09-22'

	bt.stop.strategy.plot(data, models$Long.Short, dates = dates, layout=T, main = 'Long Short Strategy', plotX = F)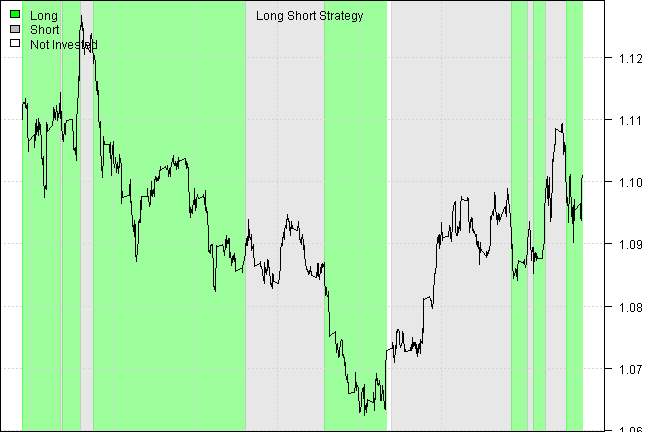
strategy.performance.snapshoot(models, T)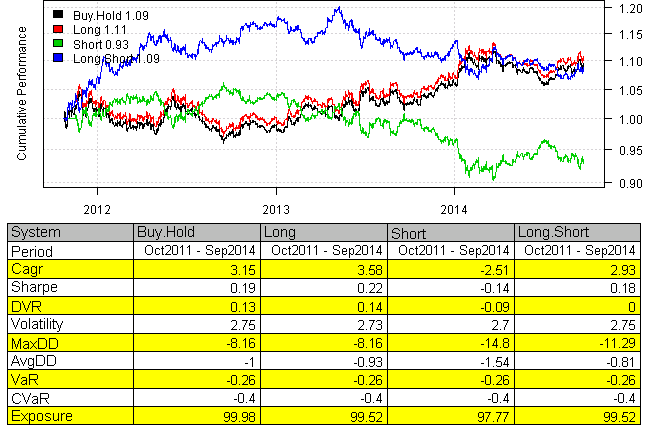 NULL
NULL
(this report was produced on: 2014-12-07)