New 60/40
To install Systematic Investor Toolbox (SIT) please visit About page.
The New 60/40 backtest and live signal. For more details please see:
The New 60/40 Strategy allocates 60% risk to equities and 40% risk to long-term treasuries.
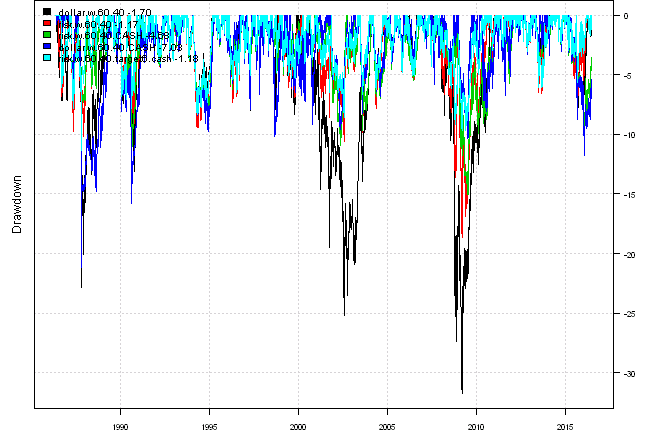
I think this strategy is missing the go to cash filter. For example of using cash filter please read the Quantitative Approach To Tactical Asset Allocation Strategy(QATAA) by Mebane T. Faber
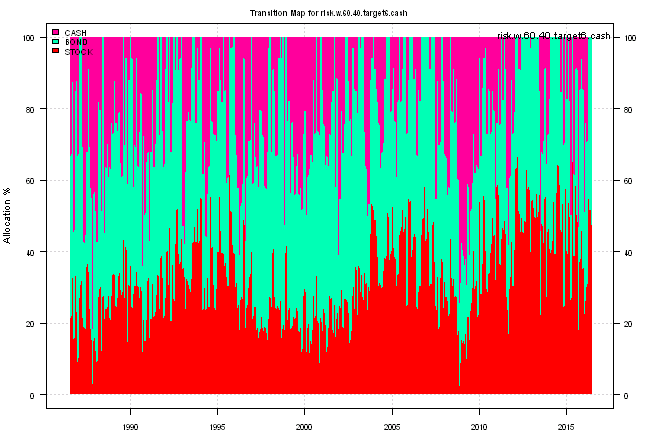
Another interesting observation is a spike in risk-parity in 2009-2010. I think this is related Volatility and “Crashing Up”
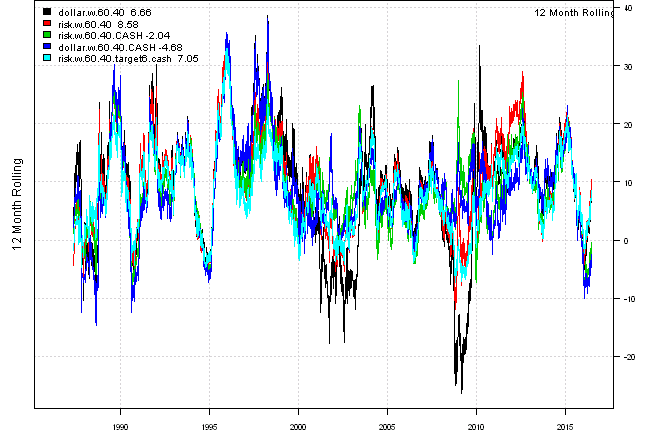
Following report is based on Monthly re-balancing, signal is generated one day before the month end, and execution is done at close at the month end.
Load historical data from Yahoo Finance:
#*****************************************************************
# Load historical data
#*****************************************************************
library(SIT)
load.packages('quantmod')

tickers = '
STOCK = SPY + VTSMX + VFINX
BOND = TLT + VUSTX
CASH = SHY + TB3Y
'

# load saved Proxies Raw Data, data.proxy.raw
load('data.proxy.raw.Rdata')

data <- new.env()

getSymbols.extra(tickers, src = 'yahoo', from = '1970-01-01', env = data, raw.data = data.proxy.raw, auto.assign = T, set.symbolnames = T, getSymbols.fn = getSymbols.fn, calendar=calendar)
  for(i in data$symbolnames) data[[i]] = adjustOHLC(data[[i]], use.Adjusted=T)
bt.prep(data, align='remove.na', dates='::')

print(last(data$prices))| STOCK | BOND | CASH | |
|---|---|---|---|
| 2016-06-24 | 203.24 | 135.78 | 85.23 |
#*****************************************************************
# Setup
#*****************************************************************
data$universe = data$prices > 0
	# do not allocate to CASH
	data$universe$CASH = NA

prices = data$prices * data$universe
	n = ncol(prices)
Code Strategy Rules:
#*****************************************************************
# Traditional, Dollar Weighted 40% Bonds & 60% Stock
#******************************************************************
target.allocation = NA * prices[1,]
	target.allocation$STOCK = 60/100
 target.allocation$BOND = 40/100

obj$weights$dollar.w.60.40 = rep.row(target.allocation, len(period.ends))

#*****************************************************************
# Risk Weighted 40% Bonds & 60% Stock
#******************************************************************
ret = diff(log(prices))
hist.vol = bt.apply.matrix(ret, runSD, n = 20)

# risk-parity
weight.risk = 1 / hist.vol
	weight.risk = weight.risk / rowSums(weight.risk, na.rm=T)

obj$weights$risk.w.60.40 = weight.risk[period.ends,]

#*****************************************************************
# Cash Filter
#******************************************************************
# compute 10 month moving average
sma = bt.apply.matrix(prices, SMA, 200)

# go to cash if prices falls below 10 month moving average
go2cash = prices < sma
  go2cash = ifna(go2cash, T)[period.ends,]


weight = obj$weights$risk.w.60.40
	weight[go2cash] = 0
weight$CASH = 1 - rowSums(weight, na.rm=T)
obj$weights$risk.w.60.40.CASH = weight


weight[] = obj$weights$dollar.w.60.40
	weight[go2cash] = 0
weight$CASH = 1 - rowSums(weight, na.rm=T)
obj$weights$dollar.w.60.40.CASH = weight

#*****************************************************************
# Scale Risk Weighted 40% Bonds & 60% Stock strategy to have 6% volatility
#******************************************************************
models = get.back.test(data, obj, input)

weight = target.vol.strategy(models$risk.w.60.40, ifna(weight.risk,0),
		target=6/100, lookback.len=21, max.portfolio.leverage=100/100)

# invested not allocated to CASH
weight$CASH = 1 - rowSums(weight)

obj$weights$risk.w.60.40.target6.cash = weight[period.ends,]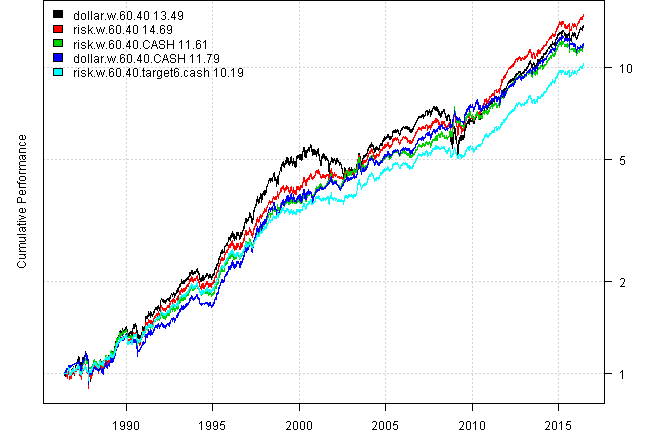
#Strategy Performance:
| dollar.w.60.40 | risk.w.60.40 | risk.w.60.40.CASH | dollar.w.60.40.CASH | risk.w.60.40.target6.cash | |
|---|---|---|---|---|---|
| Period | May1986 - Jun2016 | May1986 - Jun2016 | May1986 - Jun2016 | May1986 - Jun2016 | May1986 - Jun2016 |
| Cagr | 9.02 | 9.33 | 8.48 | 8.54 | 8.01 |
| Sharpe | 0.83 | 1.08 | 1.08 | 0.97 | 1.18 |
| DVR | 0.76 | 0.96 | 0.99 | 0.89 | 1.1 |
| R2 | 0.91 | 0.89 | 0.92 | 0.92 | 0.93 |
| Volatility | 11.11 | 8.62 | 7.84 | 8.84 | 6.7 |
| MaxDD | -31.76 | -18.66 | -15.04 | -21.19 | -11.39 |
| Exposure | 99.88 | 99.6 | 99.88 | 99.88 | 99.31 |
| Win.Percent | 61.3 | 61.11 | 65.32 | 65.41 | 64.42 |
| Avg.Trade | 0.39 | 0.4 | 0.38 | 0.39 | 0.25 |
| Profit.Factor | 1.7 | 1.82 | 2.03 | 2.01 | 1.92 |
| Num.Trades | 721 | 720 | 692 | 691 | 995 |
#Monthly Results for risk.w.60.40.target6.cash :
| Jan | Feb | Mar | Apr | May | Jun | Jul | Aug | Sep | Oct | Nov | Dec | Year | MaxDD | |
|---|---|---|---|---|---|---|---|---|---|---|---|---|---|---|
| 1986 | 0.0 | -0.1 | 4.5 | -4.9 | 1.8 | 1.9 | -2.2 | 0.7 | -6.0 | |||||
| 1987 | 1.9 | 1.8 | -0.3 | -3.1 | -0.3 | 1.9 | 1.4 | 0.3 | -2.6 | -0.3 | 0.1 | 2.1 | 2.6 | -11.4 |
| 1988 | 3.4 | 1.3 | -2.1 | -0.4 | -0.9 | 4.1 | -0.8 | -0.7 | 3.2 | 2.0 | -1.4 | 0.4 | 8.0 | -4.5 |
| 1989 | 3.4 | -1.8 | 1.0 | 3.1 | 3.1 | 2.9 | 3.8 | -0.9 | 0.0 | 1.2 | 1.1 | 0.7 | 18.9 | -3.1 |
| 1990 | -4.8 | 0.0 | 0.6 | -2.0 | 6.0 | 1.0 | 0.6 | -5.1 | 0.1 | 1.3 | 3.3 | 1.9 | 2.4 | -7.8 |
| 1991 | 2.0 | 1.5 | 0.7 | 0.9 | 1.1 | -1.5 | 2.3 | 3.0 | 1.4 | 0.4 | -1.0 | 5.9 | 17.9 | -2.6 |
| 1992 | -2.6 | 0.8 | -1.3 | 1.2 | 1.8 | 0.0 | 3.9 | -0.5 | 1.3 | -0.7 | 1.8 | 2.3 | 8.0 | -4.1 |
| 1993 | 1.5 | 1.4 | 0.7 | -0.4 | 0.8 | 2.3 | 0.6 | 3.9 | -0.2 | 1.0 | -1.7 | 0.7 | 11.0 | -3.6 |
| 1994 | 2.9 | -3.5 | -3.0 | -0.5 | 0.2 | -0.9 | 2.3 | 1.8 | -2.3 | 0.7 | -0.9 | 0.9 | -2.6 | -8.3 |
| 1995 | 2.7 | 3.4 | 1.6 | 2.0 | 6.1 | 1.3 | 0.7 | 1.0 | 3.2 | 1.2 | 3.1 | 2.2 | 32.6 | -2.0 |
| 1996 | 1.3 | -2.1 | -0.5 | -0.4 | 0.4 | 1.2 | -2.2 | 0.0 | 2.8 | 3.0 | 3.9 | -2.4 | 4.8 | -6.5 |
| 1997 | 1.2 | 0.1 | -2.3 | 2.6 | 1.6 | 2.0 | 5.1 | -2.5 | 2.4 | 1.1 | 1.2 | 1.7 | 14.9 | -5.1 |
| 1998 | 1.7 | 1.2 | 2.0 | 0.6 | 0.5 | 2.2 | -0.7 | -0.2 | 3.7 | 0.0 | 0.9 | 2.4 | 15.2 | -4.8 |
| 1999 | 1.3 | -3.8 | 0.9 | 0.8 | -1.5 | 0.9 | -1.0 | -0.3 | 0.3 | 1.1 | 0.0 | 0.8 | -0.7 | -5.3 |
| 2000 | -1.0 | 1.3 | 3.4 | -0.8 | -0.3 | 1.9 | 0.5 | 2.7 | -2.4 | 0.9 | 1.6 | 1.8 | 9.8 | -4.1 |
| 2001 | 1.2 | -1.2 | -1.2 | -0.5 | 0.2 | -0.3 | 2.0 | 0.4 | -1.6 | 2.9 | -2.0 | -0.7 | -1.0 | -6.5 |
| 2002 | 0.1 | 0.2 | -1.9 | 0.6 | 0.1 | -0.8 | 0.0 | 3.6 | 0.4 | -0.4 | 0.8 | 0.3 | 2.9 | -5.4 |
| 2003 | -0.9 | 1.4 | -0.9 | 3.4 | 6.1 | -0.3 | -3.0 | 0.8 | 1.5 | 0.8 | 0.7 | 3.2 | 13.1 | -6.6 |
| 2004 | 1.7 | 1.6 | 0.1 | -3.7 | 0.4 | 0.9 | -0.6 | 2.2 | 0.9 | 1.5 | 0.1 | 2.2 | 7.5 | -6.2 |
| 2005 | -0.1 | 0.1 | -0.9 | 0.8 | 2.6 | 1.2 | 0.4 | 0.9 | -1.6 | -2.3 | 1.5 | 0.9 | 3.4 | -4.8 |
| 2006 | 0.6 | 0.9 | -2.2 | -0.7 | -1.4 | 0.6 | 1.4 | 2.3 | 2.2 | 1.9 | 2.1 | -1.0 | 7.0 | -5.1 |
| 2007 | 0.3 | 0.9 | -0.7 | 1.9 | 0.3 | -1.2 | 0.6 | 1.5 | 1.0 | 1.2 | 1.7 | -0.7 | 7.1 | -4.3 |
| 2008 | -0.7 | -0.6 | 0.5 | -0.3 | -0.9 | -1.4 | -0.5 | 1.8 | -1.8 | -3.8 | 3.6 | 3.3 | -1.0 | -8.5 |
| 2009 | -5.1 | -2.1 | 2.4 | -0.7 | -0.2 | 0.1 | 2.0 | 1.9 | 2.2 | -1.4 | 2.5 | -2.6 | -1.4 | -7.8 |
| 2010 | -0.8 | 0.7 | 1.0 | 2.1 | -0.6 | 1.0 | 1.7 | 2.8 | 2.7 | 0.2 | -0.7 | 1.0 | 11.8 | -3.7 |
| 2011 | 0.8 | 2.4 | -0.1 | 2.5 | 0.7 | -2.0 | 1.1 | 1.5 | 1.8 | 2.1 | 0.7 | 1.8 | 14.2 | -2.7 |
| 2012 | 1.7 | 1.7 | 0.6 | 1.5 | 0.9 | 1.1 | 2.6 | 0.5 | 0.5 | -1.3 | 0.8 | -1.1 | 9.7 | -3.0 |
| 2013 | 1.2 | 1.2 | 1.6 | 3.1 | -2.4 | -1.8 | 0.6 | -1.8 | 1.5 | 3.0 | -0.2 | 0.6 | 6.7 | -6.1 |
| 2014 | 1.1 | 2.1 | 0.8 | 1.3 | 2.7 | 1.0 | -0.6 | 4.2 | -1.5 | 2.5 | 2.0 | 1.2 | 18.0 | -2.4 |
| 2015 | 2.9 | -0.3 | -0.4 | -0.6 | -0.1 | -1.8 | 2.8 | -3.4 | 0.2 | 2.8 | -0.3 | -0.8 | 1.0 | -5.6 |
| 2016 | 0.6 | 1.5 | 1.9 | -0.1 | 1.2 | 1.1 | 6.3 | -1.7 | ||||||
| Avg | 0.6 | 0.4 | 0.1 | 0.5 | 0.9 | 0.5 | 0.9 | 0.9 | 0.5 | 0.8 | 0.9 | 0.9 | 8.0 | -5.1 |
#Trades for risk.w.60.40.target6.cash :
| risk.w.60.40.target6.cash | weight | entry.date | exit.date | nhold | entry.price | exit.price | return |
|---|---|---|---|---|---|---|---|
| BOND | 48.5 | 2015-10-30 | 2015-11-30 | 31 | 120.79 | 119.75 | -0.42 |
| CASH | 6.1 | 2015-10-30 | 2015-11-30 | 31 | 84.46 | 84.24 | -0.02 |
| STOCK | 35.3 | 2015-11-30 | 2015-12-31 | 31 | 205.32 | 201.77 | -0.61 |
| BOND | 50 | 2015-11-30 | 2015-12-31 | 31 | 119.75 | 119.39 | -0.15 |
| CASH | 14.7 | 2015-11-30 | 2015-12-31 | 31 | 84.24 | 84.12 | -0.02 |
| STOCK | 24.2 | 2015-12-31 | 2016-01-29 | 29 | 201.77 | 191.73 | -1.21 |
| BOND | 27.3 | 2015-12-31 | 2016-01-29 | 29 | 119.39 | 126.04 | 1.52 |
| CASH | 48.5 | 2015-12-31 | 2016-01-29 | 29 | 84.12 | 84.67 | 0.32 |
| STOCK | 27.3 | 2016-01-29 | 2016-02-29 | 31 | 191.73 | 191.57 | -0.02 |
| BOND | 48.5 | 2016-01-29 | 2016-02-29 | 31 | 126.04 | 129.93 | 1.5 |
| CASH | 24.2 | 2016-01-29 | 2016-02-29 | 31 | 84.67 | 84.76 | 0.03 |
| STOCK | 29.4 | 2016-02-29 | 2016-03-31 | 31 | 191.57 | 204.46 | 1.98 |
| BOND | 41.2 | 2016-02-29 | 2016-03-31 | 31 | 129.93 | 129.81 | -0.04 |
| CASH | 29.4 | 2016-02-29 | 2016-03-31 | 31 | 84.76 | 84.88 | 0.04 |
| STOCK | 54.5 | 2016-03-31 | 2016-04-29 | 29 | 204.46 | 205.26 | 0.21 |
| BOND | 45.5 | 2016-03-31 | 2016-04-29 | 29 | 129.81 | 128.86 | -0.33 |
| STOCK | 51.5 | 2016-04-29 | 2016-05-31 | 32 | 205.26 | 208.75 | 0.88 |
| BOND | 48.5 | 2016-04-29 | 2016-05-31 | 32 | 128.86 | 129.89 | 0.39 |
| STOCK | 48.5 | 2016-05-31 | 2016-06-24 | 24 | 208.75 | 203.24 | -1.28 |
| BOND | 51.5 | 2016-05-31 | 2016-06-24 | 24 | 129.89 | 135.78 | 2.33 |
#Signals for risk.w.60.40.target6.cash :
| STOCK | BOND | CASH | |
|---|---|---|---|
| 2014-10-30 | 24 | 45 | 30 |
| 2014-11-26 | 59 | 41 | 0 |
| 2014-12-30 | 41 | 41 | 18 |
| 2015-01-29 | 50 | 50 | 0 |
| 2015-02-26 | 50 | 32 | 18 |
| 2015-03-30 | 26 | 24 | 50 |
| 2015-04-29 | 64 | 36 | 0 |
| 2015-05-28 | 38 | 24 | 38 |
| 2015-06-29 | 58 | 33 | 9 |
| 2015-07-30 | 50 | 41 | 9 |
| 2015-08-28 | 18 | 29 | 53 |
| 2015-09-29 | 36 | 48 | 15 |
| 2015-10-29 | 45 | 48 | 6 |
| 2015-11-27 | 35 | 50 | 15 |
| 2015-12-30 | 24 | 27 | 48 |
| 2016-01-28 | 27 | 48 | 24 |
| 2016-02-26 | 29 | 41 | 29 |
| 2016-03-30 | 55 | 45 | 0 |
| 2016-04-28 | 52 | 48 | 0 |
| 2016-05-27 | 48 | 52 | 0 |
For your convenience, the Strategy-NEW-60-40 report can also be downloaded and viewed the pdf format.
(this report was produced on: 2016-06-25)