Volatility Strategy
17 Nov 2014To install Systematic Investor Toolbox (SIT) please visit About page.
Volatility Risk Premium (VRP)
A quick test of the results presented at:
- DDNs Volatility Risk Premium Strategy Revisited (2)
- Volatility Risk Premium Trading Volatility (Part I)
- Volatility Risk Premium: Sharpe 2+, Return to Drawdown 3+
- Chasing the Volatility Risk Premium
- Easy Volatility Investing by Tony Cooper at Double-Digit Numerics
- MarketSci VIX & Volatility
- How Does the CBOEs VIX Index Work?
- Reconstructing VXX from CBOE futures data > Do you have equivalent code to recreate historical VXZ data? > Just read the VXZ brochure and adjust the calculation accordingly
How to calculate the VXX price and how does backwardation and contango influence it
Paid Data:
Strtegies:
A Failed Attempt at Backtesting Structural Arbitrage Trading VXX with nearest neighbors prediction
Helmuth Vollmeier You can download a “long” XIV and “long” VXX back to the start of VIX futures 2004 from my Dropbox which is updated daily with CSI data via a small R-script. VXX: https://dl.dropboxusercontent.com/s/950x55x7jtm9x2q/VXXlong.TXT XIV: https://dl.dropboxusercontent.com/s/jk6der1s5lxtcfy/XIVlong.TXT
Ilya , Samuel update: ZIV & VXZ, reconstructed according to the method outlined in their prospectus VXZ: https://www.dropbox.com/s/y3cg6d3vwtkwtqx/VXZlong.TXT ZIV: https://www.dropbox.com/s/jk3ortdyru4sg4n/ZIVlong.TXT
Frank says:The rationale behind is very easy: Sell (volatiity) risk when there is fear in the market: (implied volatility overestimates realized volatility), and vice versa. Even the most simple strategy based on that concept: Go long XIV at todays close if the VIX index will close below the front month VIX futures contract, or go long VXX if it will close above. Hold until a change in position. came up with 50+% annualized returns over the course of the last 10 years (including the financial crisis and the most recent bull market). See http://volatilitymadesimple.com/backtest-comparing-the-vix-index-to-front-month-vix-futures/
Instruments:
- VIX - CBOE Volatility Index
- XIV (inverse volatility)(inverse 1-month VIX) - VelocityShares Daily Inverse VIX Short-Term ETN
- VXX (long volatility)(long 1-month VIX) - iPath S&P 500 VIX Short-Term Futures
- VXZ - iPath S&P 500 VIX Mid-Term Futures
Strategy rules:
- At the close, calculate the following:
- the 5-day average of the [VIX index (10 day historical volatility of SPY * 100)]. Note that historical volatility is based on the natural log of each days % change.
- Go long XIV at the close when the result of the above formula is greater than 0, otherwise go long VXX. Hold until a change in position
Based on Reconstructing VXX from CBOE futures data ,
I was able to reconstruct VXX from CBOE futures. I made a helper function reconstruct.VXX.CBOE
to show steps needed to reconstruct VXX.
I also made another helper function, cboe.volatility.term.structure.SPX, to download an plot VIX Term Structure.
For comparison I used historical VXX data from Free Historical VXX Data >1) From the raw VX contract data, there are 33 Month-2 data values that have missing values, How did you fill those values? I filled them by using the same Month-2 to Month-1 ratio as the first subsequent non-missing value.
I just put NA’s
  #*****************************************************************
  # Load historical data
  #******************************************************************
  library(SIT)
  load.packages('quantmod')
  tickers = spl('VXX')

  data <- new.env()
getSymbols(tickers, src = 'yahoo', from = '1980-01-01', env = data, set.symbolnames = F, auto.assign = T)

load.packages('gdata,data.table')
Next let’s load historical data
  # load data from [Free Historical VXX Data](https://marketsci.wordpress.com/2012/04/18/free-historical-vxx-data/)
  temp = read.xls('data/VXX.20120416.xlsx', sheet=1, header=T,perl=perl)
  data$VXX.HIST = make.stock.xts(make.xts(temp$VXX, as.POSIXct(temp$DATE)))

  data$VXX.LONG = read.xts("data/VXXlong.TXT", format='%Y-%m-%d' )
data$VXX.LONG$Adjusted = data$VXX.LONG$Close

  # reconstruct VXX
  temp = reconstruct.VXX.CBOE()
  data$VXX.CBOE = make.stock.xts(temp$VXX)

print(bt.start.dates(data))| Start | |
|---|---|
| VXX.LONG | 2004-03-26 |
| VXX | 2009-01-30 |
| VXX.CBOE | 2004-03-26 |
| VXX.HIST | 2004-03-26 |
proxy.test(data) 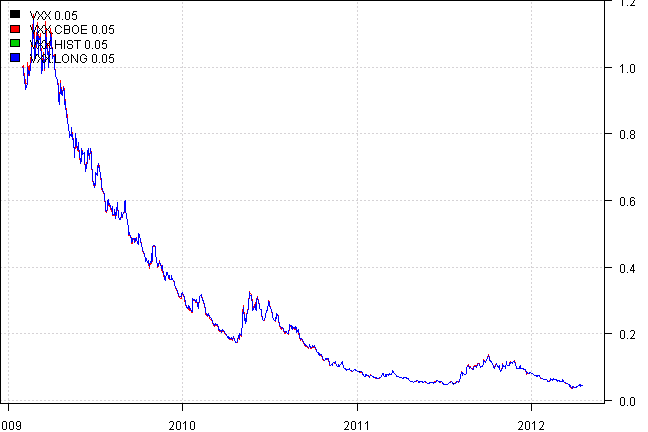
| VXX | VXX.CBOE | VXX.HIST | VXX.LONG | |
|---|---|---|---|---|
| VXX | 98% | 100% | 100% | |
| VXX.CBOE | 98% | 98% | ||
| VXX.HIST | 100% | |||
| Mean | -77.4% | -74.6% | -77.4% | -77.4% |
| StDev | 62.1% | 66.3% | 62.1% | 62.1% |
proxy.test(data, spl('VXX.HIST,VXX.CBOE,VXX.LONG')) 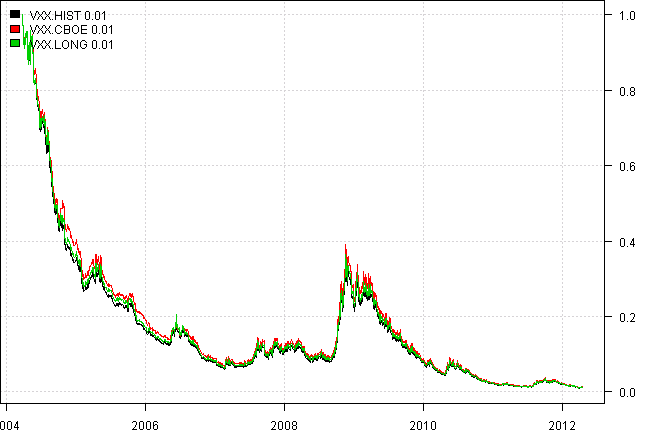
| VXX.HIST | VXX.CBOE | VXX.LONG | |
|---|---|---|---|
| VXX.HIST | 98% | 100% | |
| VXX.CBOE | 98% | ||
| Mean | -40.6% | -38.2% | -40.3% |
| StDev | 55.7% | 57.3% | 55.2% |
proxy.test(data, spl('VXX,VXX.CBOE,VXX.LONG')) 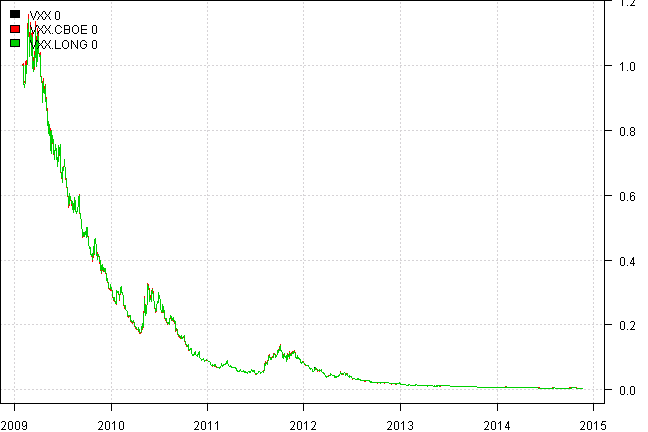
| VXX | VXX.CBOE | VXX.LONG | |
|---|---|---|---|
| VXX | 96% | 100% | |
| VXX.CBOE | 96% | ||
| Mean | -76.3% | -72.7% | -76.3% |
| StDev | 59.7% | 65.4% | 59.7% |
proxy.test(data, spl('VXX,VXX.CBOE')) 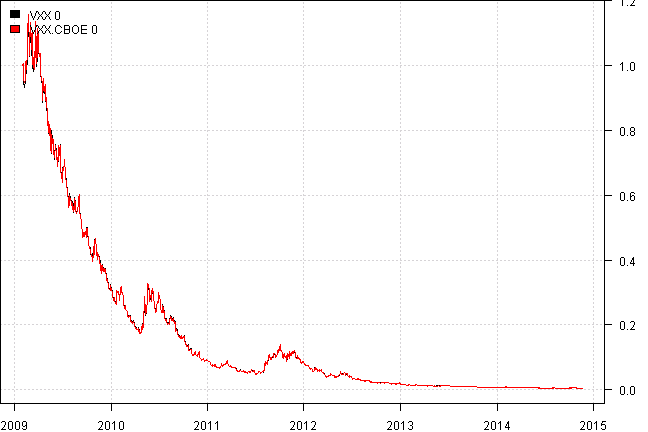
| VXX | VXX.CBOE | |
|---|---|---|
| VXX | 96% | |
| Mean | -76.3% | -72.7% |
| StDev | 59.7% | 65.4% |
plota(temp$VXX,type='l',lwd=2, main='VXX reconstructed from CBOE futures')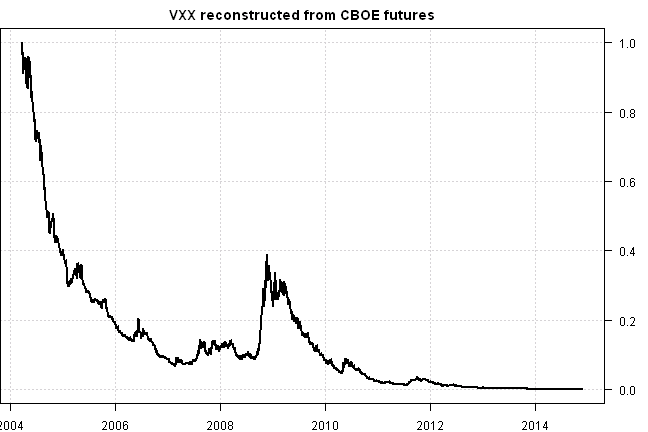
So we can use following VXX + VXX.LONG to extend VXX in getSymbols.extra
  tickers = spl('VXZ')

  data <- new.env()
getSymbols(tickers, src = 'yahoo', from = '1980-01-01', env = data, set.symbolnames = F, auto.assign = T)

  # reconstruct VXZ
  temp = reconstruct.VXX.CBOE()
  data$VXZ.CBOE = make.stock.xts(temp$VXZ)

  data$VXZ.LONG = read.xts("data/VXZlong.TXT", format='%Y-%m-%d' )
data$VXZ.LONG$Adjusted = data$VXZ.LONG$Close


print(bt.start.dates(data))| Start | |
|---|---|
| VXZ.LONG | 2004-03-26 |
| VXZ | 2009-02-20 |
| VXZ.CBOE | 2004-03-26 |
proxy.test(data) 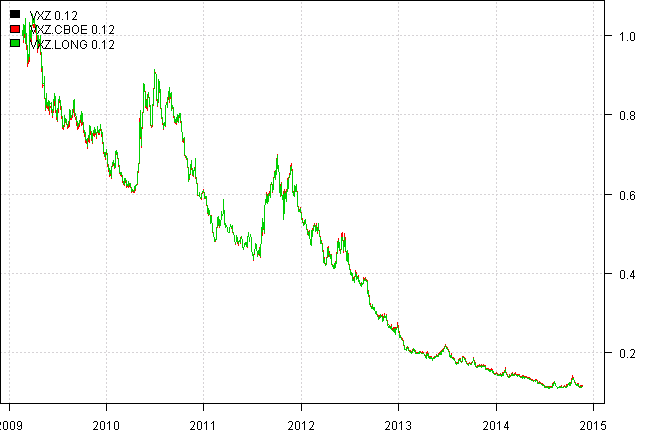
| VXZ | VXZ.CBOE | VXZ.LONG | |
|---|---|---|---|
| VXZ | 94% | 100% | |
| VXZ.CBOE | 94% | ||
| Mean | -33.0% | -32.5% | -33.0% |
| StDev | 29.9% | 30.8% | 29.9% |
proxy.test(data, spl('VXZ.CBOE,VXZ.LONG')) 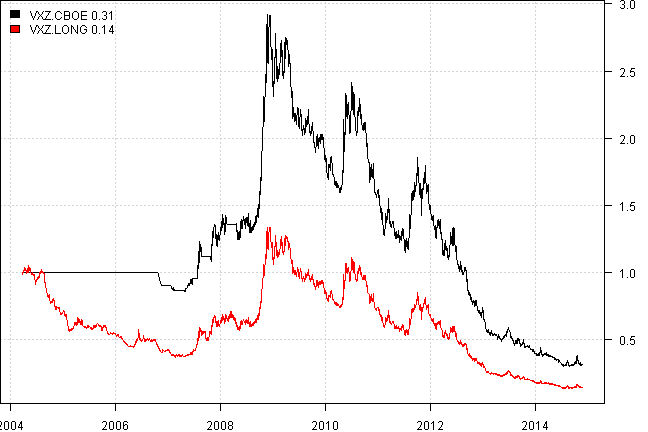
| VXZ.CBOE | VXZ.LONG | |
|---|---|---|
| VXZ.CBOE | 88% | |
| Mean | -7.3% | -14.2% |
| StDev | 27.3% | 29.1% |
plota(temp$VXZ,type='l',lwd=2, main='VXZ reconstructed from CBOE futures') 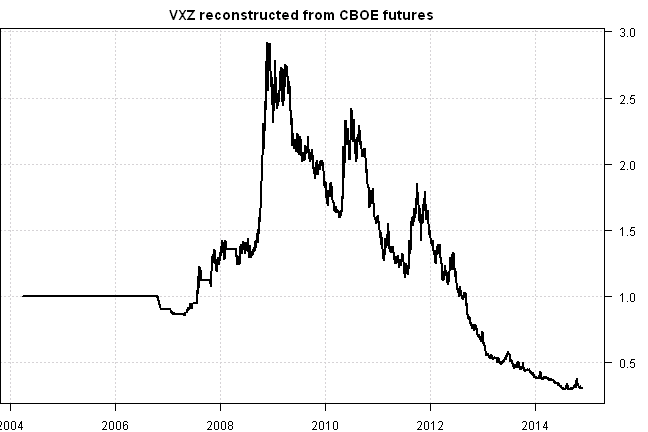
So we can use following VXZ + VXZ.LONG to extend VXZ in getSymbols.extra
Finally let’s plot VIX Term Structure.
print(cboe.volatility.term.structure.SPX())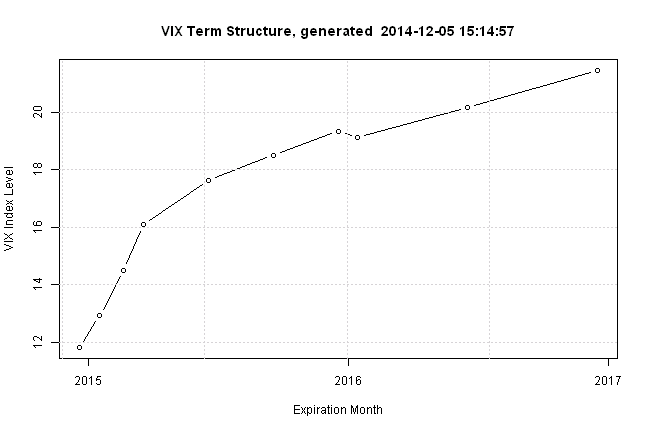
| trade.date | expiration.date | vix | contract.month |
|---|---|---|---|
| 2014-12-05 15:14:57 | 2014-12-20 | 11.81 | 1 |
| 2014-12-05 15:14:57 | 2015-01-17 | 12.91 | 2 |
| 2014-12-05 15:14:57 | 2015-02-20 | 14.50 | 3 |
| 2014-12-05 15:14:57 | 2015-03-20 | 16.08 | 4 |
| 2014-12-05 15:14:57 | 2015-06-19 | 17.63 | 5 |
| 2014-12-05 15:14:57 | 2015-09-18 | 18.50 | 6 |
| 2014-12-05 15:14:57 | 2015-12-19 | 19.34 | 7 |
| 2014-12-05 15:14:57 | 2016-01-15 | 19.12 | 8 |
| 2014-12-05 15:14:57 | 2016-06-17 | 20.16 | 9 |
| 2014-12-05 15:14:57 | 2016-12-16 | 21.47 | 10 |
(this report was produced on: 2014-12-07)