Extending-Leveraged-Series
23 Mar 2015To install Systematic Investor Toolbox (SIT) please visit About page.
We can use extend.data function to extend time series using historical proxy. For example: ‘EEM = extend.data(EEM, VEIEX, scale=T)`
The same procedure can be applied to extend leverage series. For example ProShares Ultra 20+ Year Treasury (UBT) can be extended using properly leveraged iShares 20+ Year Treasury Bond (TLT) series.
Let’s look at few examples:
#*****************************************************************
# Load historical data
#*****************************************************************
library(SIT)
load.packages('quantmod')

tickers = spl('TMF,UBT,TLT')

data = new.env()
getSymbols(tickers, src = 'yahoo', from = '1970-01-01', env = data, auto.assign = T)

TLTx2 = create.leveraged(data$TLT, leverage=2)
proxy.test(list(UBT=data$UBT, TLTx2=TLTx2),price.fn=Ad)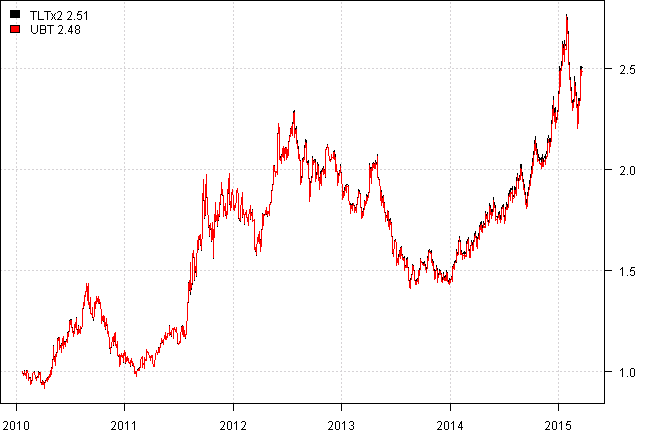
| TLTx2 | UBT | |
|---|---|---|
| TLTx2 | 99% | |
| Mean | 22.5% | 22.2% |
| StDev | 30.6% | 30.1% |
The create.leveraged function simply multiplies out the daily series returns by the given leverage factor.
Another example is Direxion Daily 20+ Yr Trsy Bull 3X ETF (TMF); it is based on a different bond index than iShares 20+ Year Treasury Bond (TLT), so it is not a perfect proxy, but will do for our testing purposes.
TLTx3 = create.leveraged(data$TLT, leverage=2)
proxy.test(list(TMF=data$TMF, TLTx3=TLTx3),price.fn=Ad)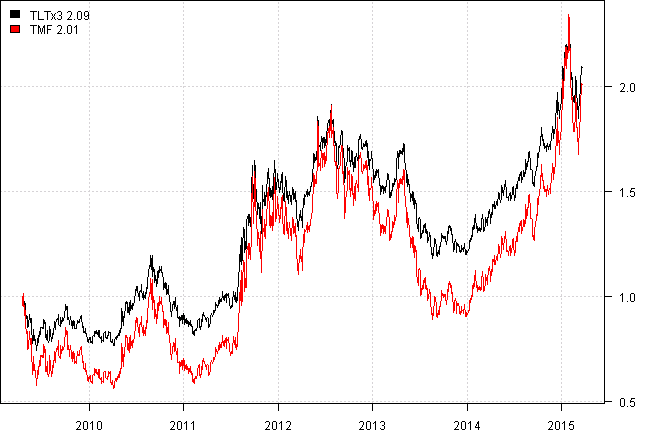
| TLTx3 | TMF | |
|---|---|---|
| TLTx3 | 100% | |
| Mean | 17.2% | 22.9% |
| StDev | 31.0% | 47.2% |
Finally let’s plot the evolution of extended 1x, 2x, 3x leverage treasury bond ETFs.
UBT = extend.data(data$UBT, create.leveraged(data$TLT, leverage=2), scale=T)
TMF = extend.data(data$TMF, create.leveraged(data$TLT, leverage=3), scale=T)

proxy.test(list(TLT=data$TLT, UBT=UBT, TMF=TMF),price.fn=Ad)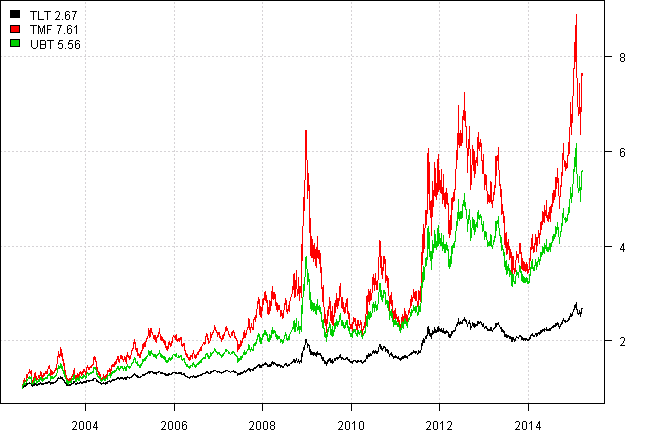
| TLT | TMF | UBT | |
|---|---|---|---|
| TLT | 100% | 100% | |
| TMF | 100% | ||
| Mean | 8.7% | 24.9% | 17.4% |
| StDev | 13.8% | 41.9% | 27.4% |
(this report was produced on: 2015-03-24)