US Relative Market Report
To install Systematic Investor Toolbox (SIT) please visit About page.
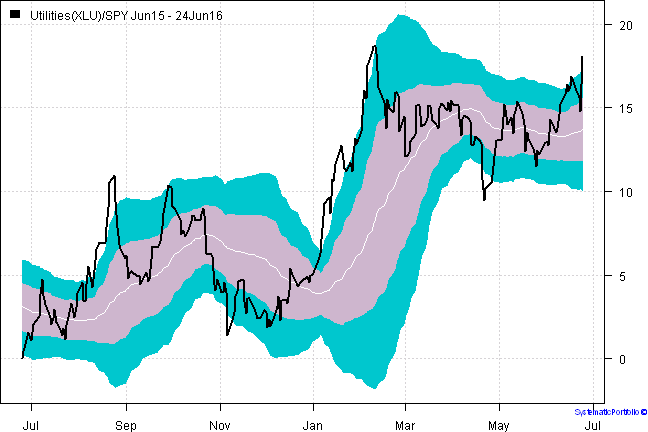
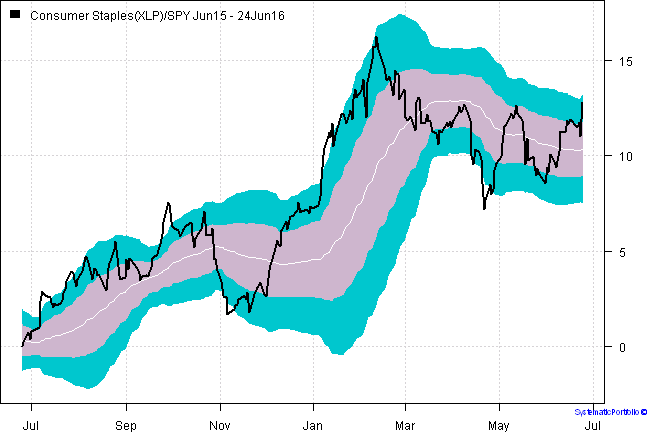
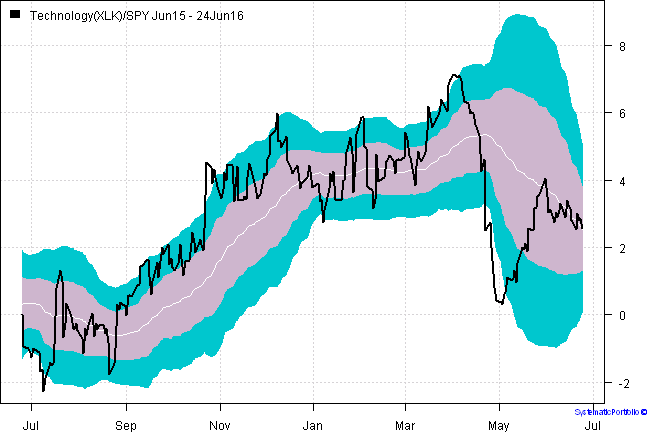
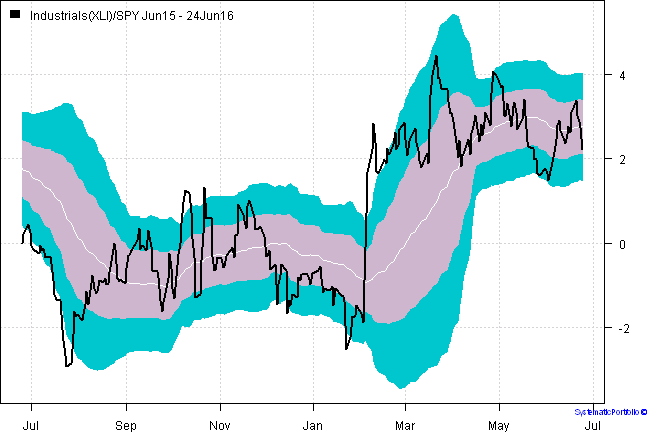
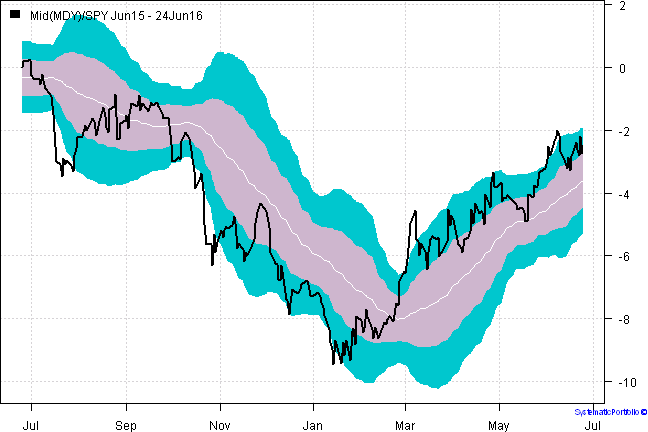
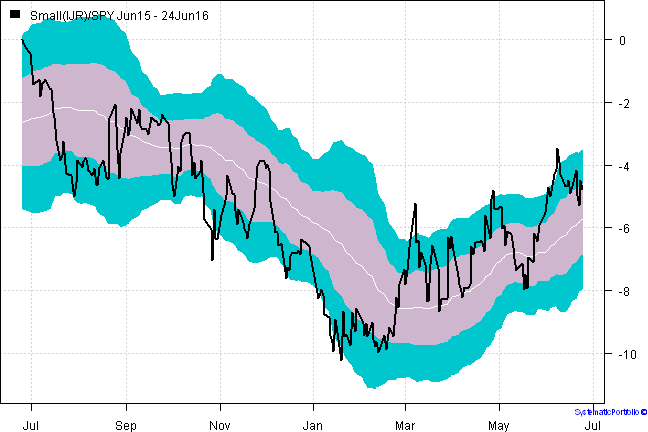
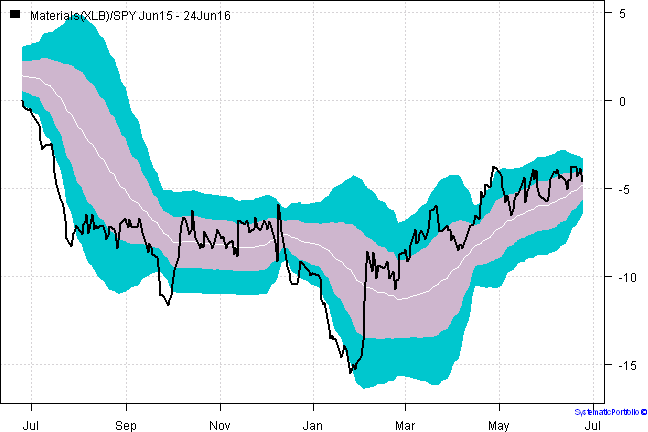
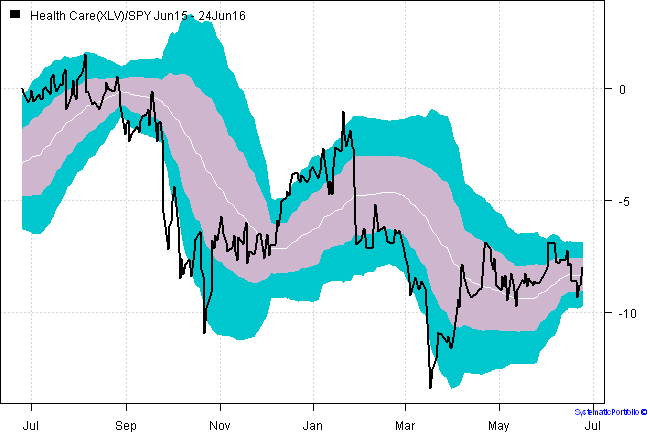
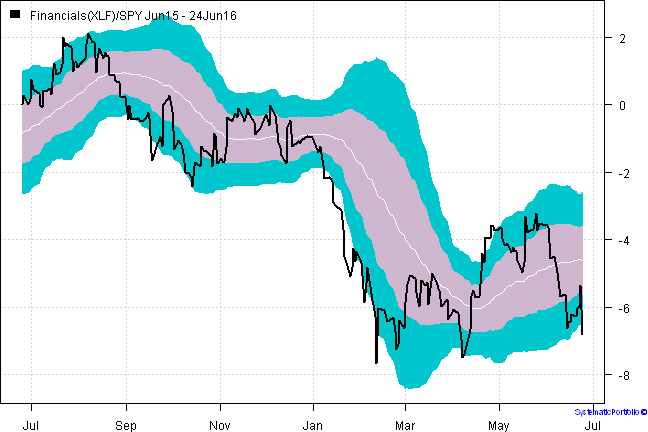
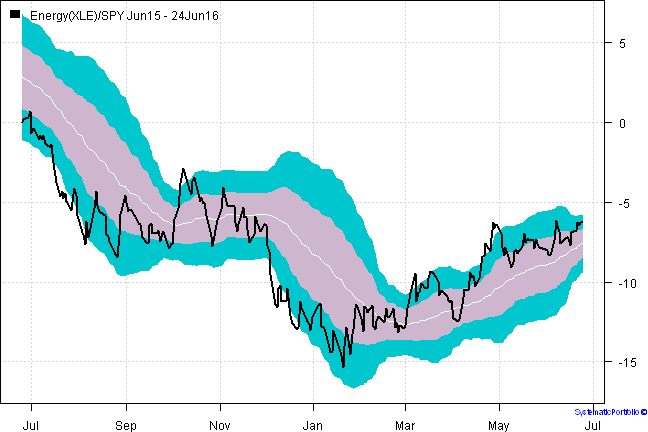
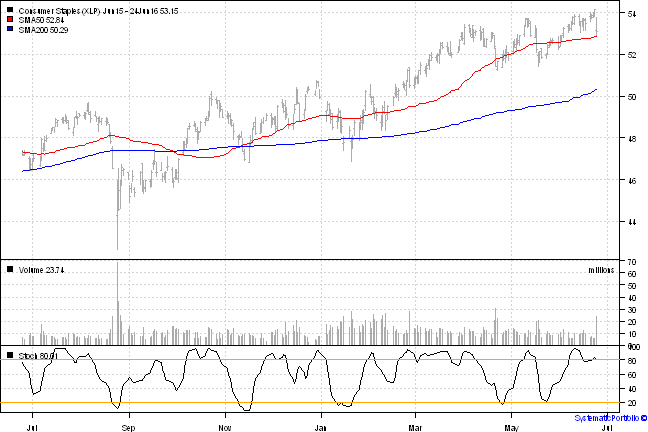
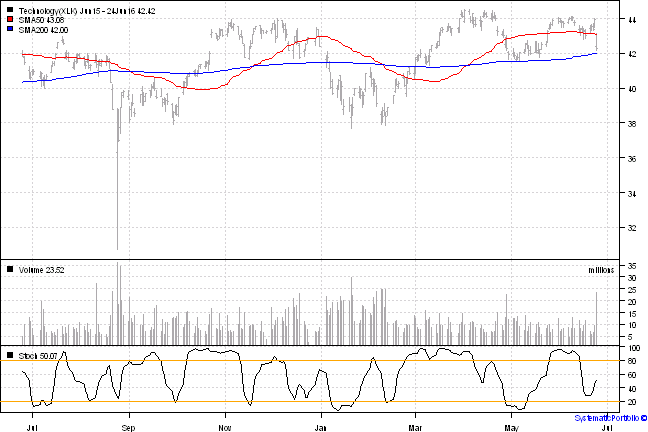
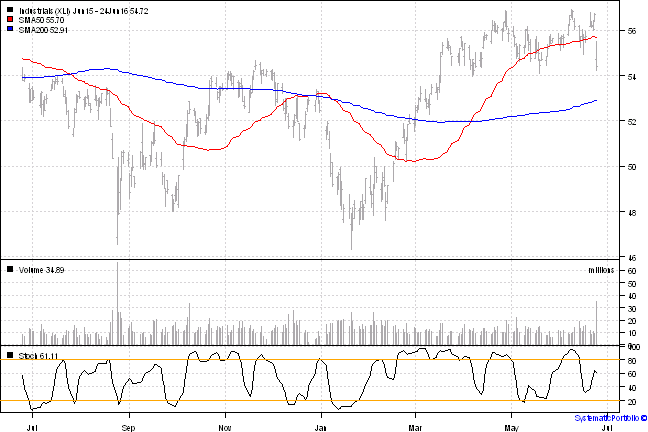
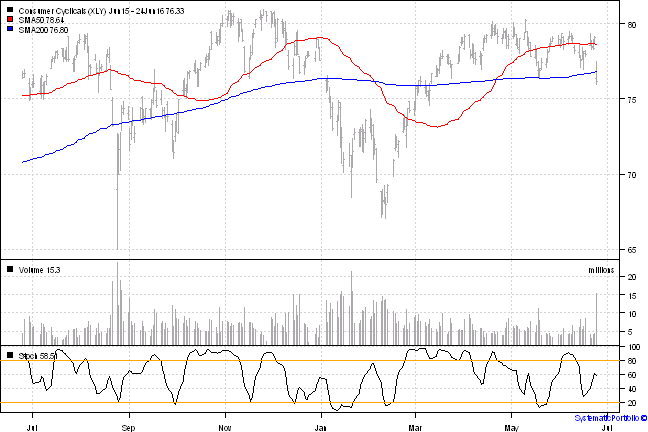
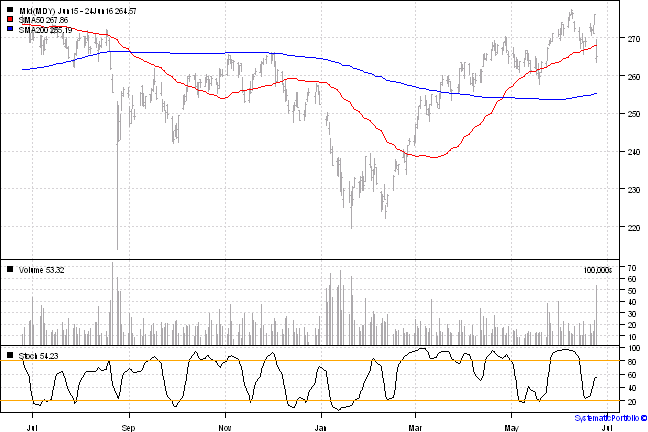
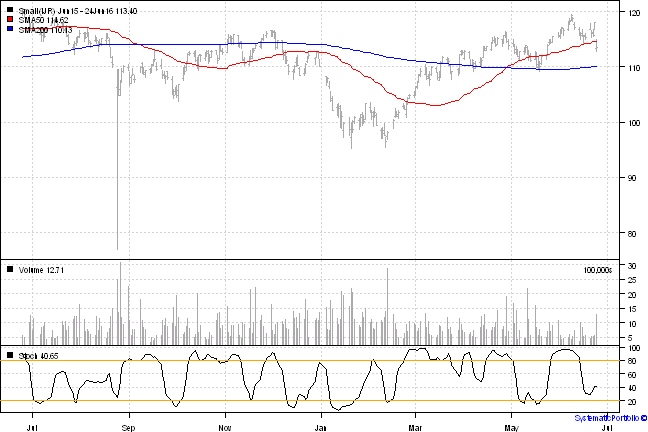
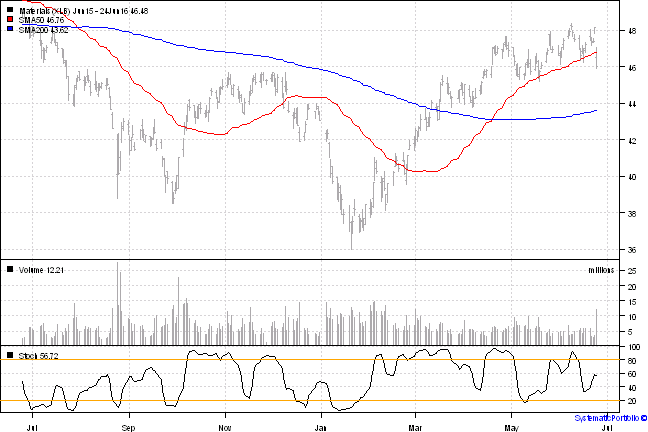
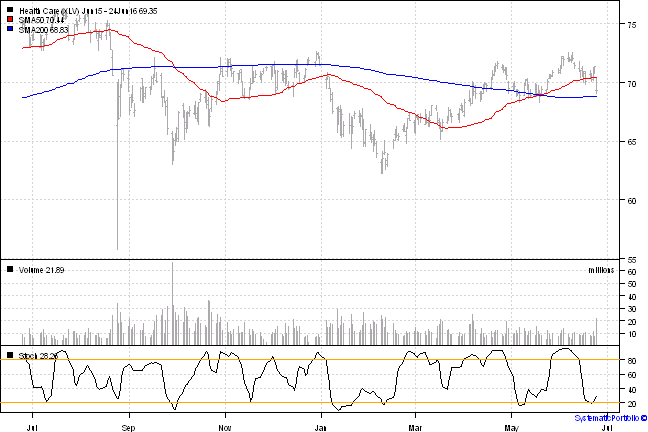
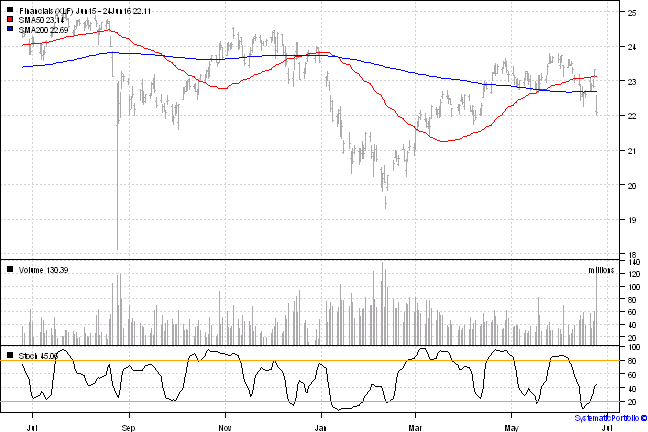
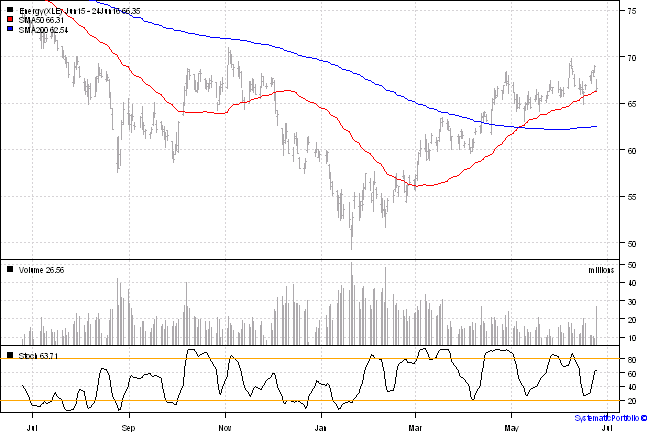
Relative Market Report is a daily report that is published every night that shows relative US Sectors performance for the last year (252 days). Following charts show each sector relative performance sorted by their one year total returns.
The black line is the sector price divided by S&P 500 price and normalized to begin at one. The blue and violet clouds show 2 and 1 standard deviation Bollinger Bands around 50 day moving average.
This report covers following ETFs:
- Consumer Cyclicals(XLY)
- Consumer Staples(XLP)
- Energy(XLE)
- Financials(XLF)
- Health Care(XLV)
- Industrials(XLI)
- Materials(XLB)
- Technology(XLK)
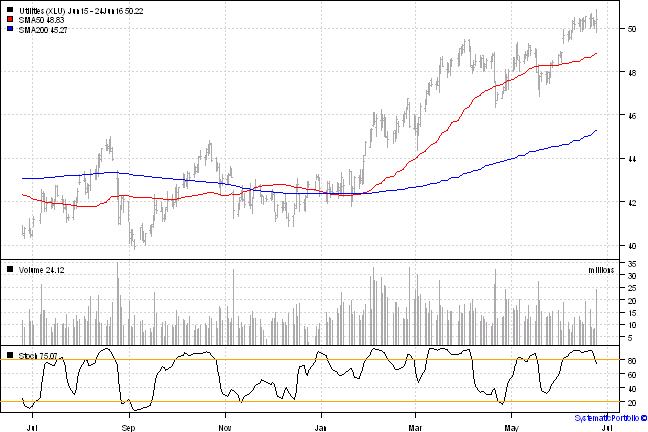
- Utilities(XLU)
- Mid Cap(MDY)
- Small Cap(IJR)
##Relative Perfromace Charts:

Detail Charts:
##Summary Perfromace:
| Jul15 | Aug15 | Sep15 | Oct15 | Nov15 | Dec15 | Jan16 | Feb16 | Mar16 | Apr16 | May16 | Jun16 | Total | |
|---|---|---|---|---|---|---|---|---|---|---|---|---|---|
| SPY | 2.3% | -6.1% | -2.6% | 8.5% | 0.4% | -1.7% | -5.0% | -0.1% | 6.7% | 0.4% | 1.7% | -2.6% | 0.9% |
| XLU | 6.1% | -3.5% | 2.9% | 1.1% | -2.1% | 1.1% | 4.9% | 1.9% | 8.0% | -2.4% | 1.5% | 3.4% | 24.7% |
| XLP | 5.7% | -6.0% | 0.4% | 5.7% | -0.9% | 2.9% | 0.5% | 0.3% | 4.7% | -1.4% | 0.7% | 1.4% | 14.4% |
| XLK | 2.9% | -5.5% | -1.3% | 10.5% | 0.7% | -2.1% | -3.7% | -0.7% | 8.8% | -5.0% | 4.9% | -3.9% | 4.1% |
| XLI | 0.3% | -5.4% | -2.2% | 8.8% | 0.9% | -2.6% | -5.7% | 4.3% | 7.0% | 1.2% | -0.4% | -2.2% | 2.8% |
| XLY | 4.9% | -6.5% | -0.6% | 9.0% | -0.2% | -2.8% | -5.2% | 0.4% | 6.7% | 0.1% | 0.1% | -3.5% | 1.2% |
| MDY | 0.1% | -5.7% | -3.2% | 5.6% | 1.3% | -4.2% | -5.5% | 1.2% | 8.5% | 1.2% | 2.2% | -2.2% | -1.7% |
| IJR | -0.8% | -5.2% | -3.5% | 6.1% | 2.7% | -4.7% | -6.2% | 1.1% | 7.8% | 1.2% | 1.6% | -2.0% | -3.0% |
| XLB | -5.0% | -5.6% | -7.4% | 13.4% | 0.9% | -5.1% | -10.7% | 7.8% | 7.6% | 5.1% | -0.3% | -1.5% | -3.6% |
| XLV | 3.0% | -8.0% | -5.7% | 7.7% | -0.3% | 1.7% | -7.7% | -0.4% | 2.7% | 3.0% | 2.2% | -2.5% | -5.4% |
| XLF | 3.4% | -7.1% | -2.8% | 6.3% | 2.0% | -2.4% | -8.9% | -2.9% | 7.3% | 3.6% | 1.9% | -6.5% | -7.4% |
| XLE | -7.7% | -4.2% | -7.2% | 11.2% | 0.0% | -11.3% | -3.5% | -2.8% | 10.2% | 9.1% | -0.9% | 0.2% | -9.6% |
For your convenience, the Tool-US-Relative-Market report can also be downloaded and viewed the pdf format.
(this report was produced on: 2016-06-25)