Monthly End-of-the-Month Strategy
To install Systematic Investor Toolbox (SIT) please visit About page.
The Monthly End-of-the-Month Strategy (MEOM) by Quanting Dutchman backtest and live signal.
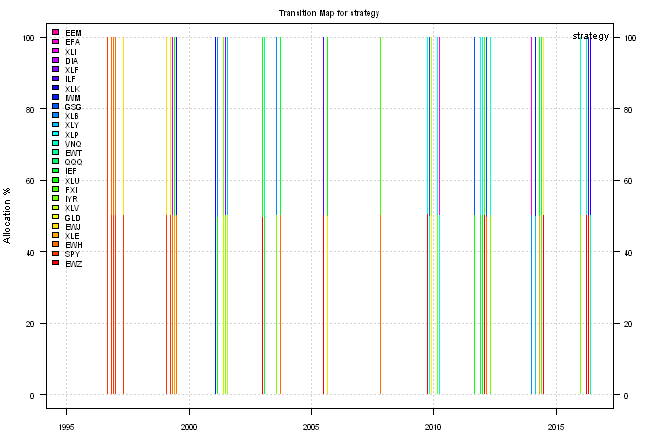
The MEOM Strategy invests into the top 2 ETFs that are trading above a medium term moving avarage (WMA89) from the universe of 26 ETFs:
- DIA
- EEM
- EFA
- EWH
- EWJ
- EWT
- EWZ
- FXI
- GLD
- GSG
- IEF
- ILF
- IWM
- IYR
- QQQ
- SPY
- VNQ
- XLB
- XLE
- XLF
- XLI
- XLP
- XLU
- XLV
- XLY
- XLK
The best asset is selected using following ranking criteria:
Rank = MA( C/Ref(C,-2), 5 ) * Ref( MA( C/Ref(C,-2), 10 ), -5 )
Following report is based on Monthly re-balancing. Signal is generated one day prior to the month end, and execution is done at close at the month end.
The strategy enters positions in the top 2 ranked ETFs on the last day of the month at the close, and exits positions two days later at the close.
Load historical data from Yahoo Finance:
#*****************************************************************
# Load historical data
#*****************************************************************
library(SIT)
load.packages('quantmod')

tickers = 'DIA,EEM,EFA,EWH,EWJ,EWT,EWZ,FXI,GLD,GSG,IEF,ILF,IWM,IYR,QQQ,SPY,VNQ,XLB,XLE,XLF,XLI,XLP,XLU,XLV,XLY,XLK'

data <- new.env()

getSymbols.extra(tickers, src = 'yahoo', from = '1970-01-01', env = data, auto.assign = T, set.symbolnames = T, getSymbols.fn = getSymbols.fn, calendar=calendar)
  for(i in data$symbolnames) data[[i]] = adjustOHLC(data[[i]], use.Adjusted=T)
bt.prep(data, align='keep.all', dates='1995::', fill.gaps=T)

print(last(data$prices))| DIA | EEM | EFA | EWH | EWJ | EWT | EWZ | FXI | GLD | GSG | IEF | ILF | IWM | IYR | QQQ | SPY | VNQ | XLB | XLE | XLF | XLI | XLP | XLU | XLV | XLY | XLK | |
|---|---|---|---|---|---|---|---|---|---|---|---|---|---|---|---|---|---|---|---|---|---|---|---|---|---|---|
| 2016-06-24 | 173.62 | 32.65 | 53.66 | 18.82 | 11.34 | 13.41 | 27.8 | 32.49 | 126 | 15.3 | 112.21 | 24.47 | 112.38 | 78.89 | 104.29 | 203.24 | 84.86 | 46.02 | 66.54 | 22.08 | 54.38 | 53.1 | 50.41 | 69.31 | 76.17 | 42.28 |
#*****************************************************************
# Setup
#*****************************************************************
data$universe = data$prices > 0
prices = data$prices * data$universe
	n = ncol(prices)
  nperiods = nrow(prices)
Code Strategy Rules:
#*****************************************************************
# Code Strategy
#******************************************************************
# BuyRule = C > WMA(C, 89)
buy.rule = prices > bt.apply.matrix(prices, function(x) { WMA(x, 89) } )
  buy.rule = ifna(buy.rule, F)

# 2-day returns
ret2 = ifna(prices / mlag(prices, 2), 0)

# Rank2 = MA( C/Ref(C,-2), 5 ) * Ref( MA( C/Ref(C,-2), 10 ), -5 )
position.score = bt.apply.matrix(ret2, SMA, 5) * mlag( bt.apply.matrix(ret2, SMA, 10), 5)
	position.score[!buy.rule] = NA

period.ends2 = iif(period.ends + 2 > nperiods, nperiods, period.ends + 2)

weight = ntop(position.score[period.ends,], 2)

models = list()

data$weight[] = NA
	data$weight[period.ends,] = 	weight
	data$weight[period.ends2,] = 0
models$strategy = bt.run.share(data, clean.signal=F, trade.summary=T, silent=T, do.lag = 1 + out$delayLen) 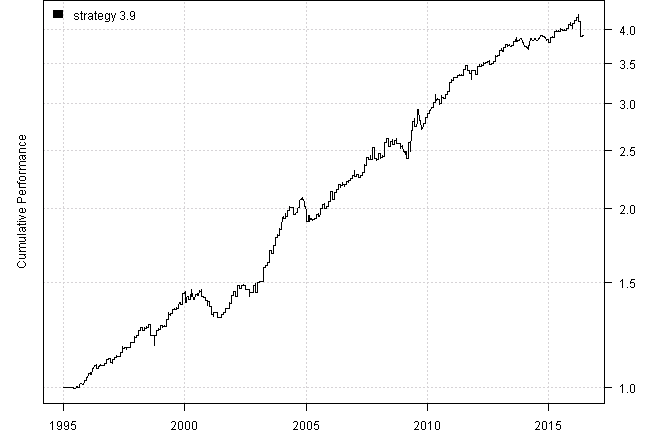
#Strategy Performance:
| strategy | |
|---|---|
| Period | Jan1995 - Jun2016 |
| Cagr | 6.54 |
| Sharpe | 0.98 |
| DVR | 0.94 |
| R2 | 0.96 |
| Volatility | 6.69 |
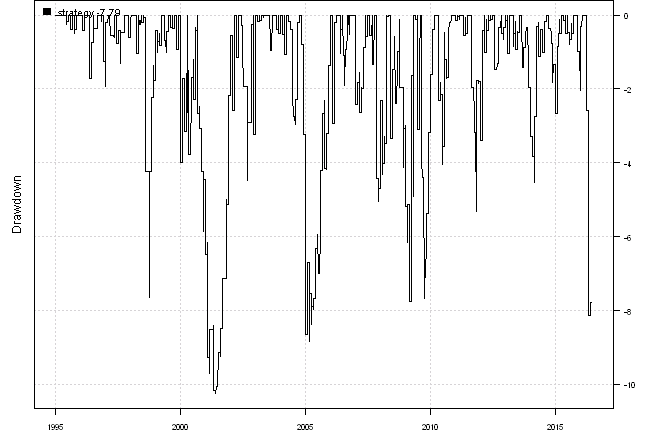
| MaxDD | -10.26 |
| Exposure | 8.99 |
| Win.Percent | 62.88 |
| Avg.Trade | 0.31 |
| Profit.Factor | 2.05 |
| Num.Trades | 458 |
#Monthly Results for strategy :
| Jan | Feb | Mar | Apr | May | Jun | Jul | Aug | Sep | Oct | Nov | Dec | Year | MaxDD | |
|---|---|---|---|---|---|---|---|---|---|---|---|---|---|---|
| 1995 | 0.0 | 0.0 | 0.0 | 0.0 | -0.2 | 0.7 | -0.4 | 1.4 | -0.4 | 1.4 | 1.4 | 4.0 | -0.5 | |
| 1996 | 1.3 | 0.0 | 2.2 | 1.4 | -1.5 | 1.0 | 0.5 | 0.0 | 0.7 | 1.5 | 0.2 | -1.2 | 6.1 | -1.7 |
| 1997 | 1.0 | 0.9 | 0.1 | 0.0 | 1.6 | 1.7 | 0.4 | -0.1 | 0.0 | 1.9 | 0.0 | 2.0 | 10.0 | -1.3 |
| 1998 | 0.7 | 2.1 | 1.0 | -1.0 | 0.9 | 0.3 | 1.0 | -4.2 | 0.0 | 0.0 | 2.1 | 0.5 | 3.3 | -7.7 |
| 1999 | 1.4 | -0.3 | -0.1 | 2.9 | 1.8 | 0.3 | 1.7 | 0.2 | 0.3 | 2.5 | -0.9 | 4.4 | 14.9 | -1.0 |
| 2000 | -3.3 | 2.4 | -1.5 | 1.2 | -1.2 | 2.2 | -0.6 | 1.9 | -2.2 | -0.4 | -1.2 | -0.2 | -3.1 | -5.9 |
| 2001 | -2.1 | -3.0 | 0.8 | 0.0 | -1.8 | 0.1 | 1.0 | 0.7 | 1.5 | 0.0 | 2.2 | 3.1 | 2.4 | -6.1 |
| 2002 | 1.6 | -2.0 | 4.2 | -1.1 | 1.3 | -0.1 | -1.7 | 0.0 | -1.0 | 0.0 | 2.7 | -2.6 | 1.2 | -4.5 |
| 2003 | 3.9 | 0.3 | 0.1 | 5.5 | 0.9 | 1.2 | 4.6 | -1.0 | 3.1 | 2.9 | 1.0 | 2.1 | 27.3 | -1.0 |
| 2004 | 4.9 | -0.2 | 0.7 | 2.2 | 1.3 | -0.2 | -2.4 | 0.5 | 2.1 | 3.2 | -0.2 | -2.4 | 9.6 | -3.2 |
| 2005 | -5.6 | 2.1 | -0.9 | -0.4 | 0.2 | 1.5 | -0.7 | 3.0 | 1.6 | -1.5 | 1.0 | 1.9 | 1.9 | -5.8 |
| 2006 | 3.7 | -2.9 | 2.8 | 1.1 | 2.0 | -0.4 | 0.2 | 0.2 | 1.2 | 0.1 | 1.1 | 1.1 | 10.5 | -2.9 |
| 2007 | -0.4 | 0.6 | -0.8 | 0.7 | 1.1 | 2.6 | 3.2 | -0.6 | 0.0 | 4.8 | -4.4 | -0.3 | 6.4 | -5.0 |
| 2008 | 2.5 | -1.7 | 0.6 | 5.3 | 1.9 | -3.4 | 1.9 | -0.9 | 1.4 | -1.0 | 0.0 | -1.1 | 5.3 | -4.1 |
| 2009 | -2.2 | 0.1 | -2.8 | 6.6 | 4.8 | 3.4 | -2.0 | 7.1 | -4.4 | -2.8 | 1.9 | 2.3 | 11.7 | -7.7 |
| 2010 | 1.6 | 1.2 | 1.0 | 2.1 | 0.8 | 0.2 | -1.4 | 2.4 | -0.5 | 1.5 | 1.1 | 3.9 | 14.7 | -4.0 |
| 2011 | 0.7 | 1.0 | 0.2 | 0.7 | 0.0 | 0.1 | 2.1 | 1.7 | -2.0 | -1.2 | 1.4 | 0.0 | 4.7 | -5.3 |
| 2012 | -1.6 | 3.1 | -0.1 | 0.6 | 0.8 | 0.1 | 0.6 | -1.0 | 0.2 | 1.0 | 1.9 | 0.2 | 5.7 | -1.6 |
| 2013 | 2.0 | -0.2 | 1.3 | 1.4 | -0.5 | -0.4 | 0.5 | 1.4 | 0.2 | 0.6 | 0.5 | -1.6 | 5.1 | -2.0 |
| 2014 | -1.4 | -0.6 | 1.1 | 2.5 | -0.8 | 0.7 | -0.6 | 0.9 | 1.0 | -0.4 | -0.4 | -0.6 | 1.4 | -2.6 |
| 2015 | -1.3 | 1.9 | 0.3 | 2.0 | 0.3 | -0.1 | 0.6 | -0.2 | 0.2 | 0.6 | 1.5 | -0.1 | 5.6 | -1.3 |
| 2016 | 0.7 | 1.2 | 1.0 | -1.6 | -5.7 | 0.4 | -4.0 | -8.1 | ||||||
| Avg | 0.4 | 0.3 | 0.5 | 1.5 | 0.4 | 0.5 | 0.5 | 0.6 | 0.2 | 0.6 | 0.6 | 0.6 | 6.6 | -3.8 |
#Trades for strategy :
| strategy | weight | entry.date | exit.date | nhold | entry.price | exit.price | return |
|---|---|---|---|---|---|---|---|
| QQQ | 50 | 2015-07-31 | 2015-08-04 | 4 | 110.71 | 110.16 | -0.25 |
| XLY | 50 | 2015-07-31 | 2015-08-04 | 4 | 78.98 | 79.05 | 0.04 |
| IEF | 100 | 2015-08-31 | 2015-09-02 | 2 | 104.77 | 104.95 | 0.18 |
| IEF | 100 | 2015-09-30 | 2015-10-02 | 2 | 106.42 | 107.02 | 0.56 |
| QQQ | 50 | 2015-10-30 | 2015-11-03 | 4 | 112.35 | 114.02 | 0.74 |
| XLK | 50 | 2015-10-30 | 2015-11-03 | 4 | 43 | 43.61 | 0.71 |
| IWM | 50 | 2015-11-30 | 2015-12-02 | 2 | 118.23 | 117.73 | -0.21 |
| XLY | 50 | 2015-11-30 | 2015-12-02 | 2 | 79.83 | 79.95 | 0.07 |
| IYR | 50 | 2015-12-31 | 2016-01-05 | 5 | 73.53 | 74.01 | 0.33 |
| VNQ | 50 | 2015-12-31 | 2016-01-05 | 5 | 78.14 | 78.69 | 0.35 |
| GLD | 50 | 2016-01-29 | 2016-02-02 | 4 | 106.95 | 108.09 | 0.53 |
| XLU | 50 | 2016-01-29 | 2016-02-02 | 4 | 44.72 | 45.34 | 0.69 |
| GLD | 50 | 2016-02-29 | 2016-03-02 | 2 | 118.64 | 118.68 | 0.02 |
| XLI | 50 | 2016-02-29 | 2016-03-02 | 2 | 51.57 | 52.62 | 1.02 |
| EWZ | 50 | 2016-03-31 | 2016-04-04 | 4 | 26.3 | 25.55 | -1.43 |
| VNQ | 50 | 2016-03-31 | 2016-04-04 | 4 | 83.05 | 82.83 | -0.14 |
| EWZ | 50 | 2016-04-29 | 2016-05-03 | 4 | 29.51 | 27.7 | -3.07 |
| ILF | 50 | 2016-04-29 | 2016-05-03 | 4 | 26.96 | 25.54 | -2.64 |
| EWT | 50 | 2016-05-31 | 2016-06-02 | 2 | 13.34 | 13.49 | 0.56 |
| XLK | 50 | 2016-05-31 | 2016-06-02 | 2 | 43.98 | 43.83 | -0.17 |
#Signals for strategy :
| DIA | EEM | EFA | EWH | EWJ | EWT | EWZ | FXI | GLD | GSG | IEF | ILF | IWM | IYR | QQQ | SPY | VNQ | XLB | XLE | XLF | XLI | XLP | XLU | XLV | XLY | XLK | |
|---|---|---|---|---|---|---|---|---|---|---|---|---|---|---|---|---|---|---|---|---|---|---|---|---|---|---|
| 2014-10-30 | 0 | 0 | 0 | 0 | 0 | 0 | 0 | 0 | 0 | 0 | 0 | 0 | 50 | 0 | 0 | 0 | 0 | 0 | 0 | 0 | 50 | 0 | 0 | 0 | 0 | 0 |
| 2014-11-26 | 0 | 0 | 0 | 0 | 0 | 0 | 0 | 0 | 0 | 0 | 0 | 0 | 0 | 0 | 0 | 0 | 0 | 50 | 0 | 0 | 0 | 0 | 0 | 0 | 50 | 0 |
| 2014-12-30 | 0 | 0 | 0 | 0 | 0 | 0 | 0 | 0 | 0 | 0 | 0 | 0 | 50 | 0 | 0 | 0 | 0 | 0 | 0 | 0 | 0 | 0 | 50 | 0 | 0 | 0 |
| 2015-01-29 | 0 | 0 | 0 | 50 | 0 | 50 | 0 | 0 | 0 | 0 | 0 | 0 | 0 | 0 | 0 | 0 | 0 | 0 | 0 | 0 | 0 | 0 | 0 | 0 | 0 | 0 |
| 2015-02-26 | 0 | 0 | 0 | 0 | 50 | 0 | 0 | 0 | 0 | 0 | 0 | 0 | 0 | 0 | 0 | 0 | 0 | 0 | 0 | 0 | 0 | 0 | 0 | 0 | 50 | 0 |
| 2015-03-30 | 0 | 0 | 0 | 50 | 0 | 0 | 0 | 50 | 0 | 0 | 0 | 0 | 0 | 0 | 0 | 0 | 0 | 0 | 0 | 0 | 0 | 0 | 0 | 0 | 0 | 0 |
| 2015-04-29 | 0 | 0 | 0 | 0 | 0 | 50 | 50 | 0 | 0 | 0 | 0 | 0 | 0 | 0 | 0 | 0 | 0 | 0 | 0 | 0 | 0 | 0 | 0 | 0 | 0 | 0 |
| 2015-05-28 | 0 | 0 | 0 | 0 | 0 | 0 | 0 | 0 | 0 | 0 | 0 | 0 | 0 | 0 | 50 | 0 | 0 | 0 | 0 | 0 | 0 | 0 | 0 | 50 | 0 | 0 |
| 2015-06-29 | 0 | 0 | 0 | 0 | 0 | 0 | 0 | 0 | 0 | 0 | 0 | 0 | 0 | 0 | 0 | 0 | 0 | 0 | 0 | 0 | 0 | 0 | 0 | 100 | 0 | 0 |
| 2015-07-30 | 0 | 0 | 0 | 0 | 0 | 0 | 0 | 0 | 0 | 0 | 0 | 0 | 0 | 0 | 50 | 0 | 0 | 0 | 0 | 0 | 0 | 0 | 0 | 0 | 50 | 0 |
| 2015-08-28 | 0 | 0 | 0 | 0 | 0 | 0 | 0 | 0 | 0 | 0 | 100 | 0 | 0 | 0 | 0 | 0 | 0 | 0 | 0 | 0 | 0 | 0 | 0 | 0 | 0 | 0 |
| 2015-09-29 | 0 | 0 | 0 | 0 | 0 | 0 | 0 | 0 | 0 | 0 | 100 | 0 | 0 | 0 | 0 | 0 | 0 | 0 | 0 | 0 | 0 | 0 | 0 | 0 | 0 | 0 |
| 2015-10-29 | 0 | 0 | 0 | 0 | 0 | 0 | 0 | 0 | 0 | 0 | 0 | 0 | 0 | 0 | 50 | 0 | 0 | 0 | 0 | 0 | 0 | 0 | 0 | 0 | 0 | 50 |
| 2015-11-27 | 0 | 0 | 0 | 0 | 0 | 0 | 0 | 0 | 0 | 0 | 0 | 0 | 50 | 0 | 0 | 0 | 0 | 0 | 0 | 0 | 0 | 0 | 0 | 0 | 50 | 0 |
| 2015-12-30 | 0 | 0 | 0 | 0 | 0 | 0 | 0 | 0 | 0 | 0 | 0 | 0 | 0 | 50 | 0 | 0 | 50 | 0 | 0 | 0 | 0 | 0 | 0 | 0 | 0 | 0 |
| 2016-01-28 | 0 | 0 | 0 | 0 | 0 | 0 | 0 | 0 | 50 | 0 | 0 | 0 | 0 | 0 | 0 | 0 | 0 | 0 | 0 | 0 | 0 | 0 | 50 | 0 | 0 | 0 |
| 2016-02-26 | 0 | 0 | 0 | 0 | 0 | 0 | 0 | 0 | 50 | 0 | 0 | 0 | 0 | 0 | 0 | 0 | 0 | 0 | 0 | 0 | 50 | 0 | 0 | 0 | 0 | 0 |
| 2016-03-30 | 0 | 0 | 0 | 0 | 0 | 0 | 50 | 0 | 0 | 0 | 0 | 0 | 0 | 0 | 0 | 0 | 50 | 0 | 0 | 0 | 0 | 0 | 0 | 0 | 0 | 0 |
| 2016-04-28 | 0 | 0 | 0 | 0 | 0 | 0 | 50 | 0 | 0 | 0 | 0 | 50 | 0 | 0 | 0 | 0 | 0 | 0 | 0 | 0 | 0 | 0 | 0 | 0 | 0 | 0 |
| 2016-05-27 | 0 | 0 | 0 | 0 | 0 | 50 | 0 | 0 | 0 | 0 | 0 | 0 | 0 | 0 | 0 | 0 | 0 | 0 | 0 | 0 | 0 | 0 | 0 | 0 | 0 | 50 |
For your convenience, the Strategy-MEOM report can also be downloaded and viewed the pdf format.
For more details please check the MEOM strategy code at bt.meom.test() function in bt.test.r at github
(this report was produced on: 2016-06-25)